Methodology
The Regulatory Indicators for Sustainable Energy (RISE) is a global inventory of policies and regulations that support the achievement of Sustainable Development Goal (SDG) 7. RISE provides policy makers with a tool to benchmark their countries’ progress over time and against peers to identify areas for policy and regulatory reform. For investors in sustainable energy projects, it provides a comprehensive picture of the investment environment and informs decision-making.
First piloted in 2014 in 17 countries, RISE then focused on three pillars: electricity access, renewable energy, and energy efficiency. After expanding its country coverage for 2018 and adding clean cooking as the fourth pillar, RISE now covers 140 countries in renewable energy and energy efficiency, 56 countries in electricity access, and 57 countries in clean cooking. The countries where RISE tracks electricity access account for 96 percent of the global population lacking access,1 while in clean cooking, RISE covers 19 of the 20 countries with the largest clean cooking deficits. Hence, RISE has comprehensive messages to convey about access.
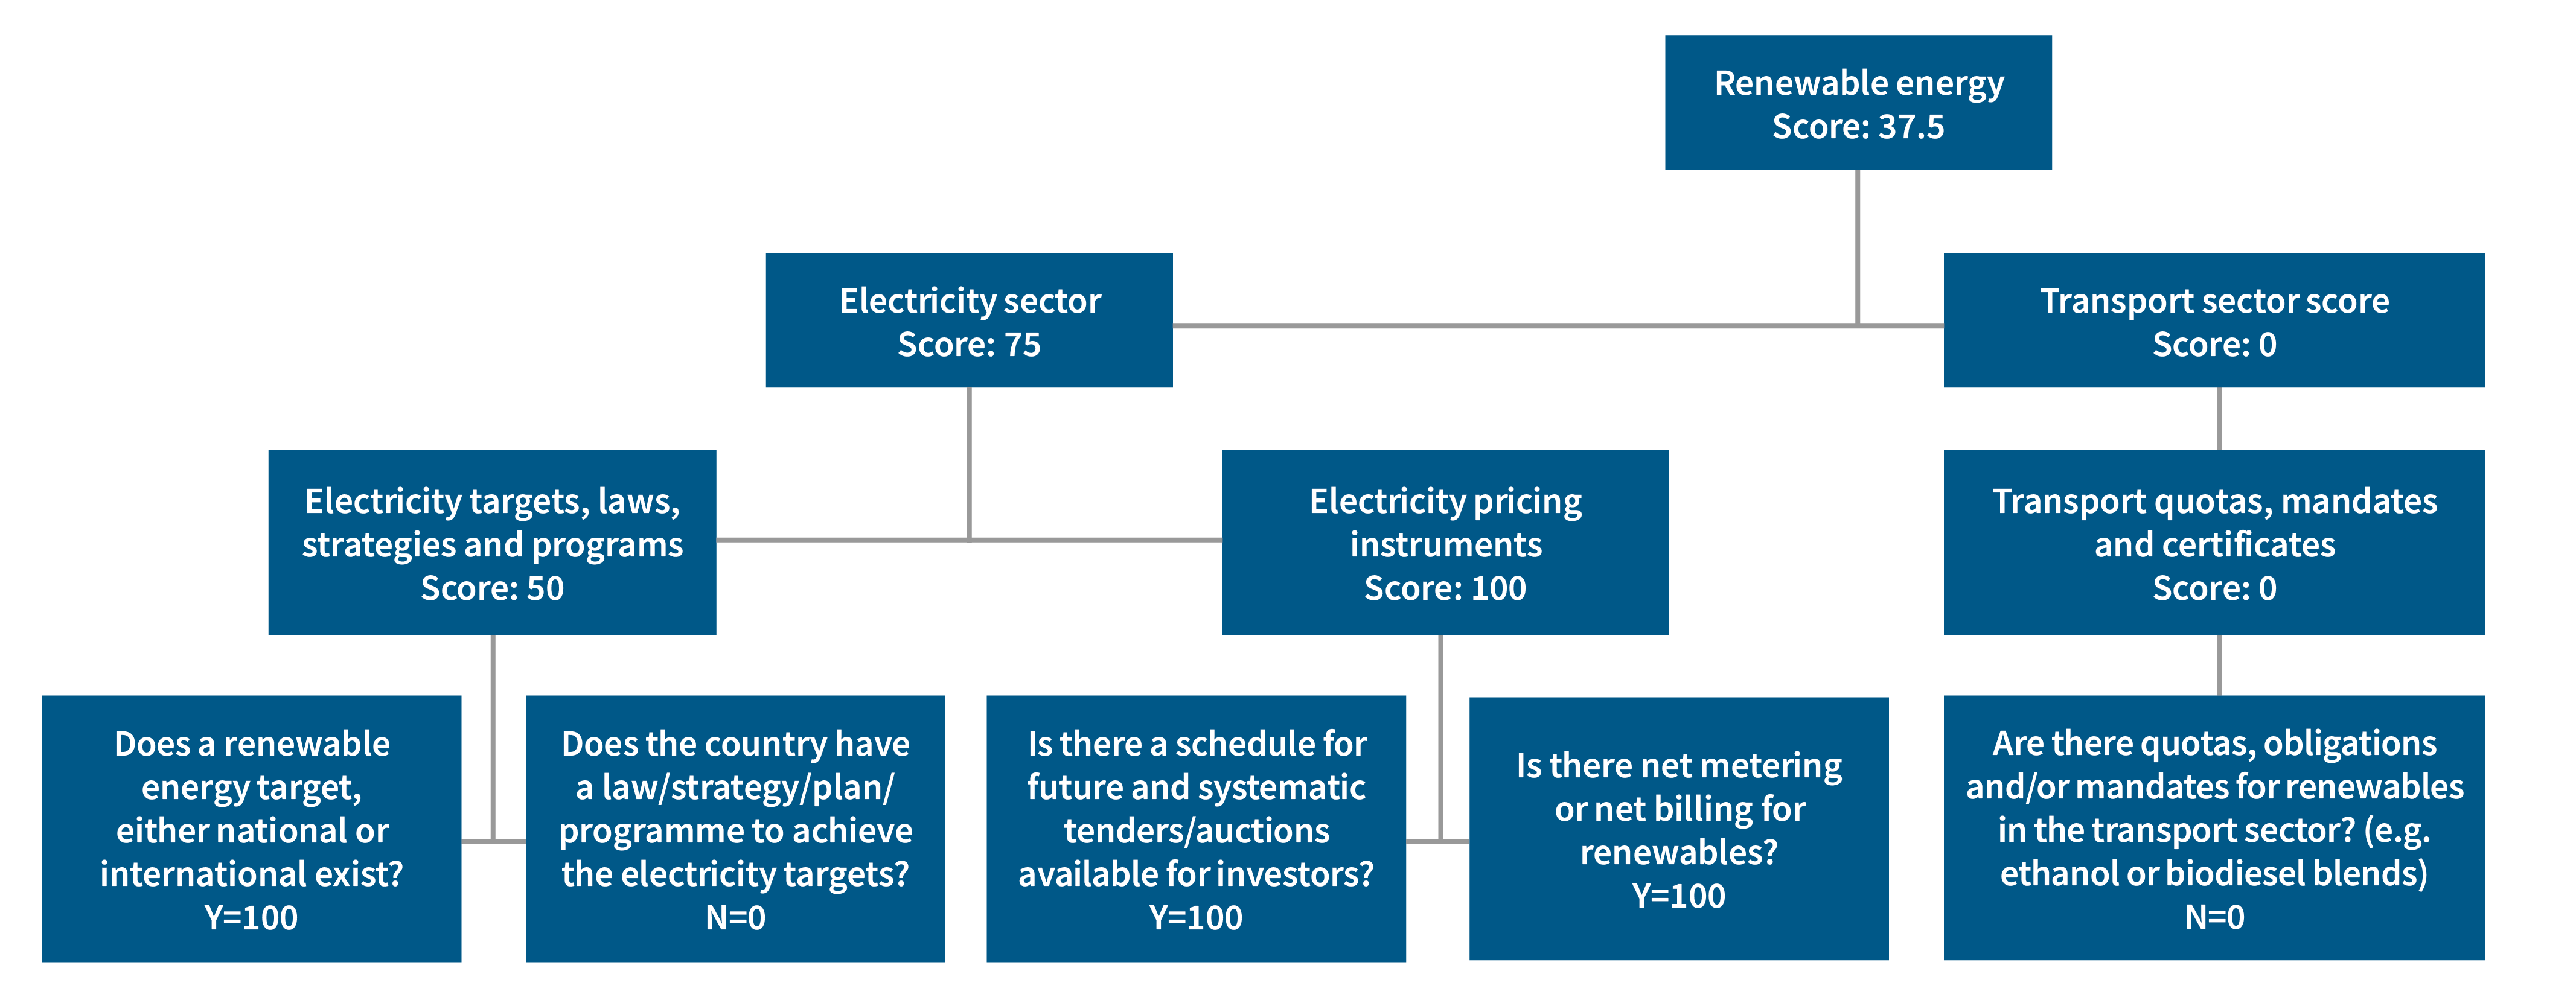
RISE follows a simple average score methodology. Scores range between 0 and 100, and all variables have equal weight when summed up to arrive at a score for each area. The pillar score (i.e., renewable energy) is the simple average of its indicators’ scores. In turn, the indicators’ scores are the simple average of the scores for subindicators. Each subindicator has a set of binary questions. The score for these questions is 100 if Yes and 0 if No. The average of those values produces the subindicators’ scores. Figure 1.1 depicts a simplified example, which should be read from bottom to top. The scores, between 0 and 100, are grouped into three categories based on a “traffic light” system: green (67–100), yellow (34–66), and red (0–33).
Figure 1.1 • RISE scoring: A simplified example
Note: This is a simplified and illustrative example. To consult all the pillars, indicators, subindicators, and questions of RISE, please visit the Indicators tab.
This simple framework has limitations. First, while the Energy Sector Management Assistance Program (ESMAP) publishes an overall RISE score, the number of constituent pillars varies across countries. For countries where electricity access and clean cooking are measured, the overall score is the simple average of the scores for the four pillars. However, for countries for which the above two pillars are not measured, the overall score is, in fact, the simple average of the scores for the electricity access, energy efficiency, and renewable energy pillars. For countries with universal electricity access, RISE assigns a score of 100 for electricity access; it assigns a “not available” (N/A) score for clean cooking when that pillar is not measured. Future publications will explore how to address this inconsistency.
Second, while simple averages naturally assign equal weight to all the variables involved, it is worth noting that the varying number of questions across subindicators, and likewise, the varying number of sub-indicators and indicators have different impacts on the scores. Simply put, as the number of questions within a subindicator increases, each question will have a reduced impact on the score. Similarly, the more subindicators there are, the less impact one will have on the indicator’s score. Figure 1.1 shows how a single question in transport can pull the score down for the pillar, compared with four questions spread across two subindicators in electricity.
The RISE methodology has another limitation: it monitors the enactment and not the implementation of policies and regulations. It is not de jure policies and regulations but de facto conditions on the ground that advance SDG 7 goals.
Every RISE publication undertakes incremental changes to improve its methodology. These incremental methodological improvements mean that the data for one edition is not comparable with data collected for previous editions. With each new iteration or publication, a new database is shared, in which the time series is adjusted to the new methodology. More specifically, if a new question is added, the year in which that given policy or regulation was first enacted is verified, and a new score for that year and the years that follow is calculated. If questions, subindicators or indicators are streamlined, then the scores are also back-calculated, so users can analyze progress in RISE scores according to the new methodology. Our time series starts in 2010—pre-2010 policies are reflected in the 2010 scores.
For this 2024 edition, the upgraded methodology sought to avoid duplication, to impose more consistency, and to ease data interpretation and analysis.
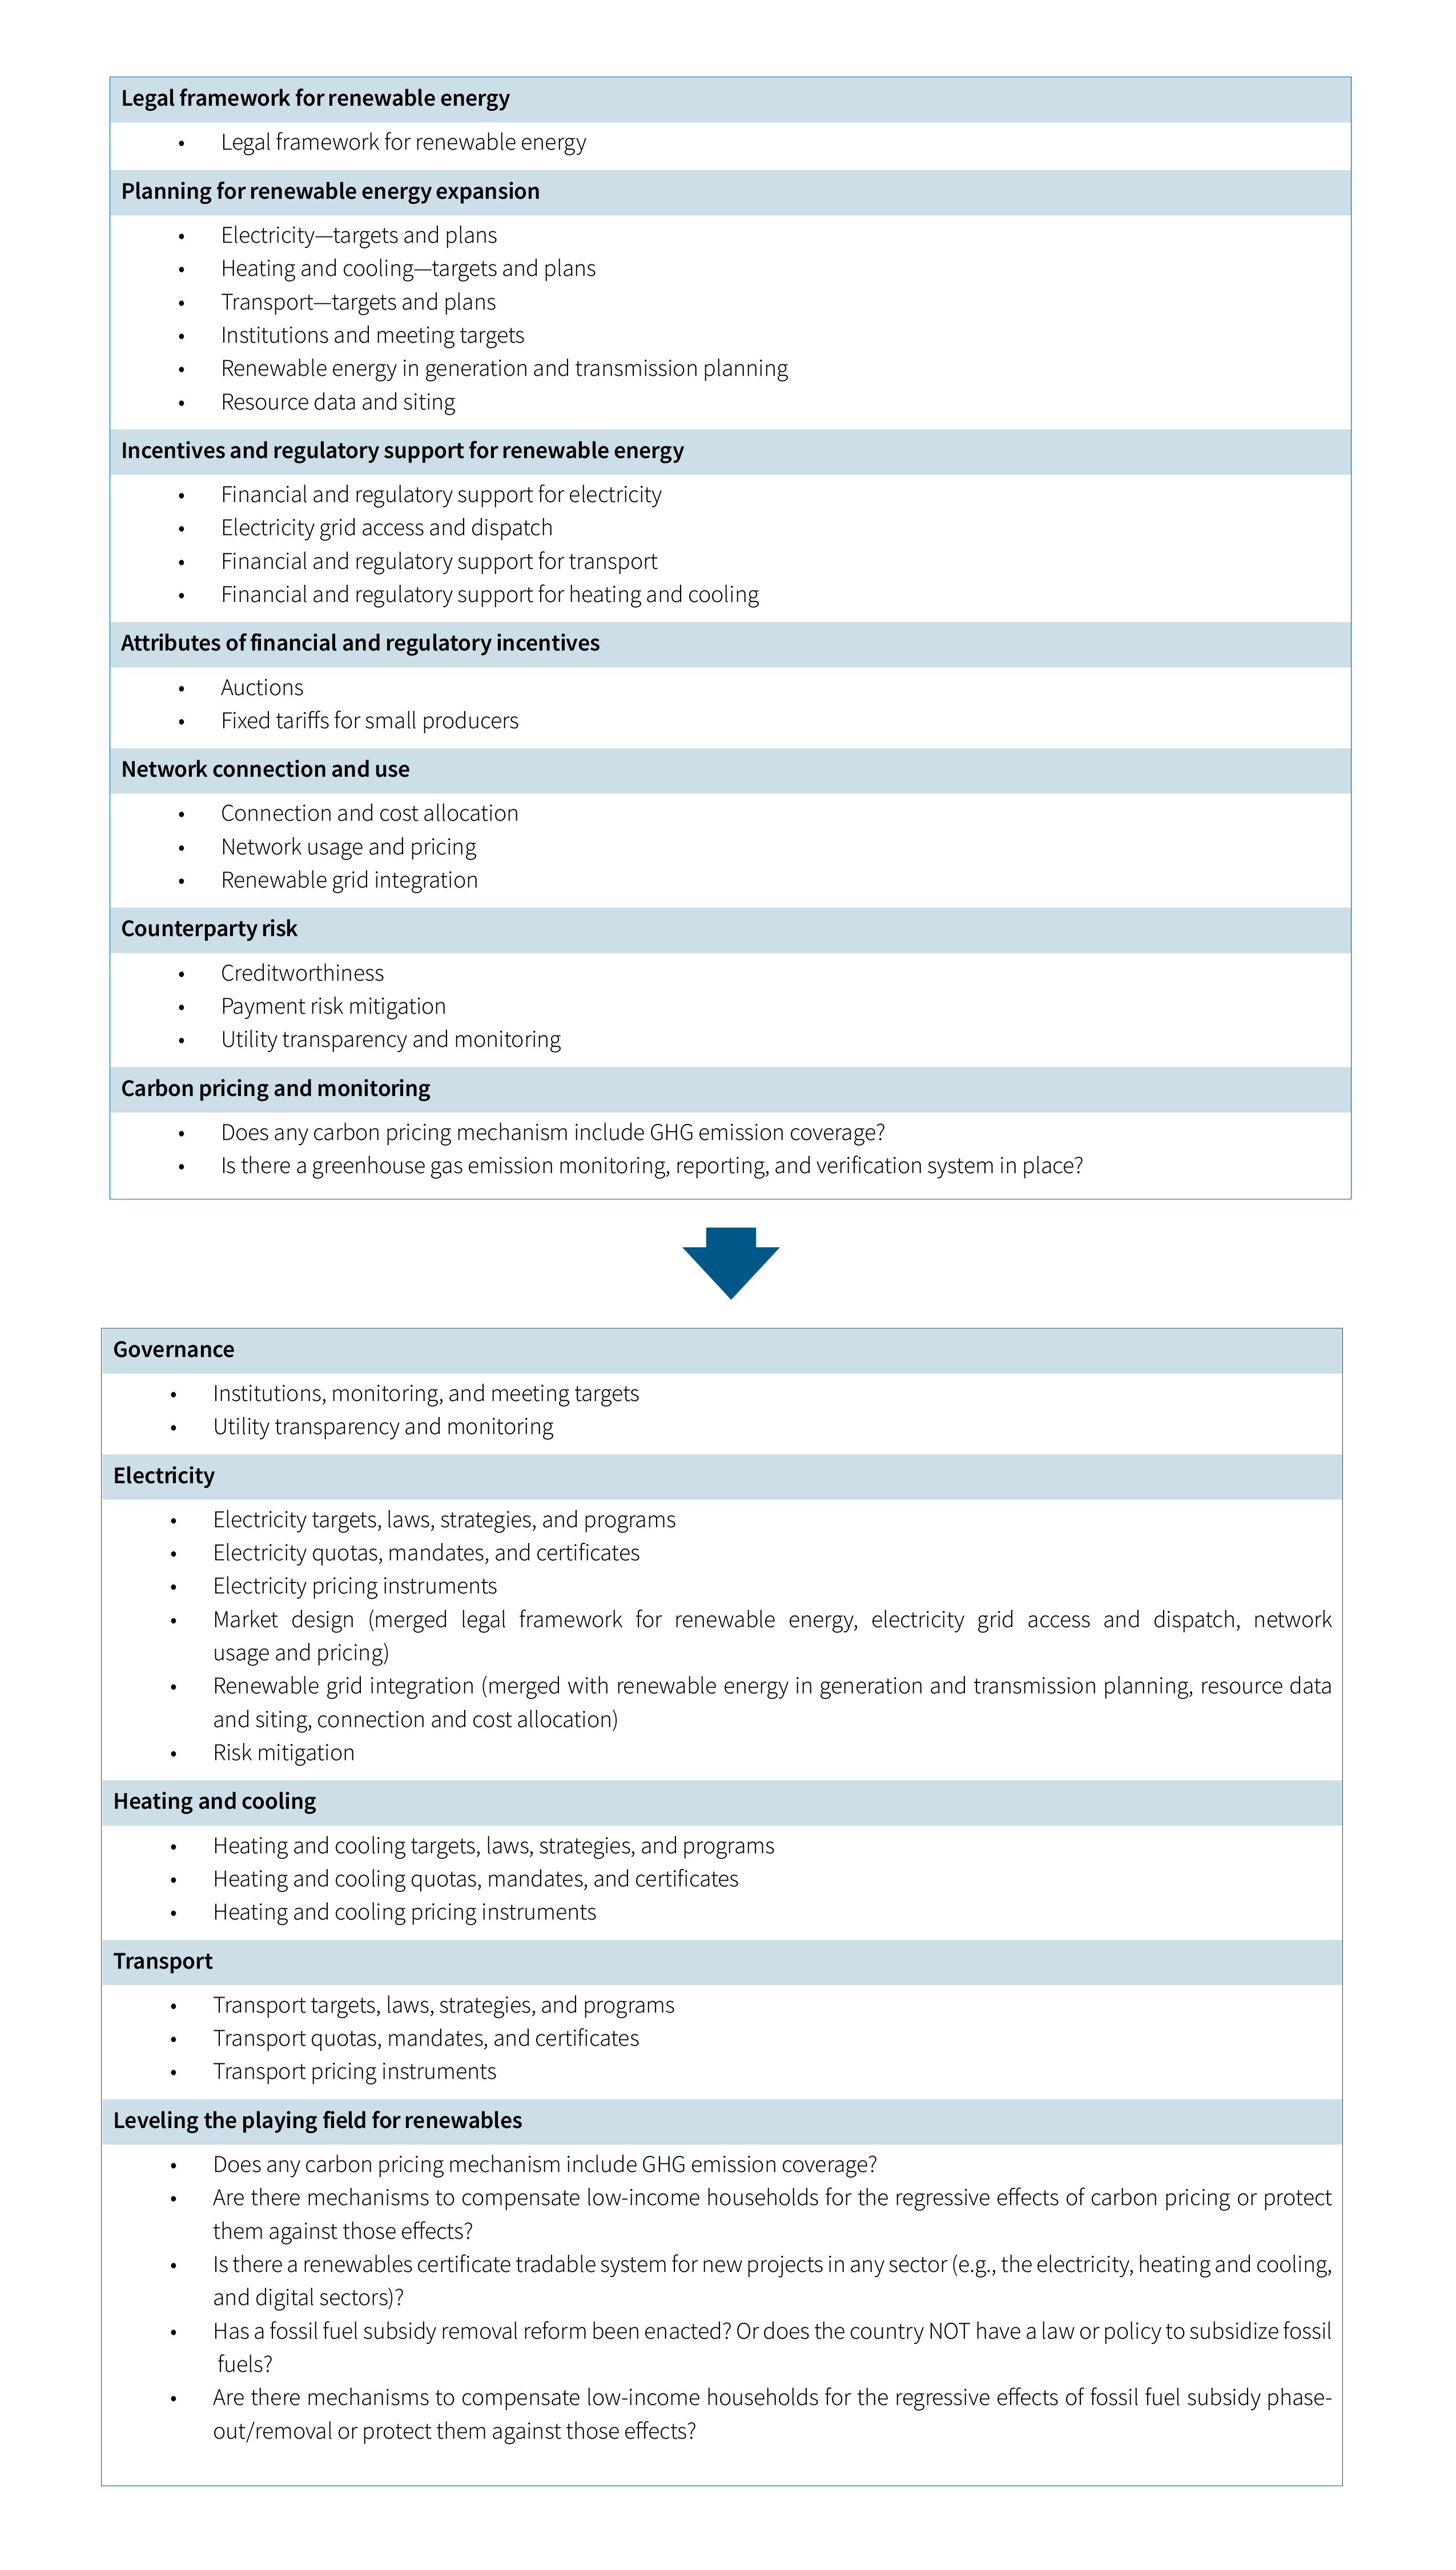
The renewable energy pillar, for example, aligned its indicators with the analyses and databases of RISE partners—the International Renewable Energy Agency (IRENA), Renewable Energy Policy Network for the 21st Century (REN21), and International Energy Agency (IEA). By classifying policies and regulations into indicators for (1) governance, (2) electricity, (3) heating and cooling, (4) transport, and (5) leveling the playing field, RISE built on and complemented their work. As an example, their information on targets and mandates across sectors was cross-checked, and new questions were added on the frameworks to monitor and penalize noncompliance with the RISE indicator for governance.
The present edition stopped tracking questions where results could not be objectively verified with reference to an official policy or regulation. Sample queries range from “Are standard PPAs bankable?” to “Is the compensation due because of curtailment actually given out?”. Likewise, utility performance indicators, such as creditworthiness, are better tracked by the Utility Performance and Behavior Today (UPBEAT) dashboard (World Bank n.d.) and are not, in fact, renewable energy policies or even regulations that policy makers can enact. They are instead outcome indicators in the electricity sector. That said, this edition retains the indicators for utility transparency and monitoring, both of which policy makers can act upon. The scoring also stops rewarding fiscal incentives (i.e., tax credits and subsidies) because the literature deems them ineffective. They are costly instruments for supporting large-scale renewable energy developments given they incur revenue losses, which must be covered through distortionary taxes (i.e., labor taxes) and most times, the projects would have taken place without the fiscal incentive in any case (Metcalf 2007; IMF 2015; Klemm 2009; Gouchoe, Everette, and Haynes 2002; OECD n.d.; Blanchard, Gollier, and Tirole 2023). Besides, low-income economies do not have the fiscal space to compete with richer economies in a race to the bottom. Nor do tax incentives address the barriers to low-carbon investments, such as access to finance, market and infrastructure risks, trade restrictions, and high up-front capital (UNCTAD 2023; Farole 2011). Similarly, subsidies for green technology are not substitutes for taxes on pollution, which are more effective in any event (Rapson and Muehlegger 2023; Fabra and Reguant 2024). Lastly, both tax credits and subsidies on green technologies are regressive, which is to say they often benefit those at the top of the income distribution (Borenstein and Davis 2016).
In the end, the renewables pillar went from seven to five indicators. This is mostly due to subindicators being reorganized and merged to fit the new indicator categories. Also, a few new subindicators (e.g., tradable renewables certificate systems and fossil fuel subsidy removal) were added to complement carbon pricing in the indicator for leveling the playing field (see annex). Again, this sectoral approach aligns with the work of RISE partners, and, we argue, eases identification and interpretation by classifying sectoral subindicators as price, quantity, or target instruments. We recognize that achieving a perfect balance among the number of questions, subindicators, and indicators across and within pillars is a herculean, perhaps impossible, task. That said, we have streamlined them in the past and will continue to do so whenever we see fit.
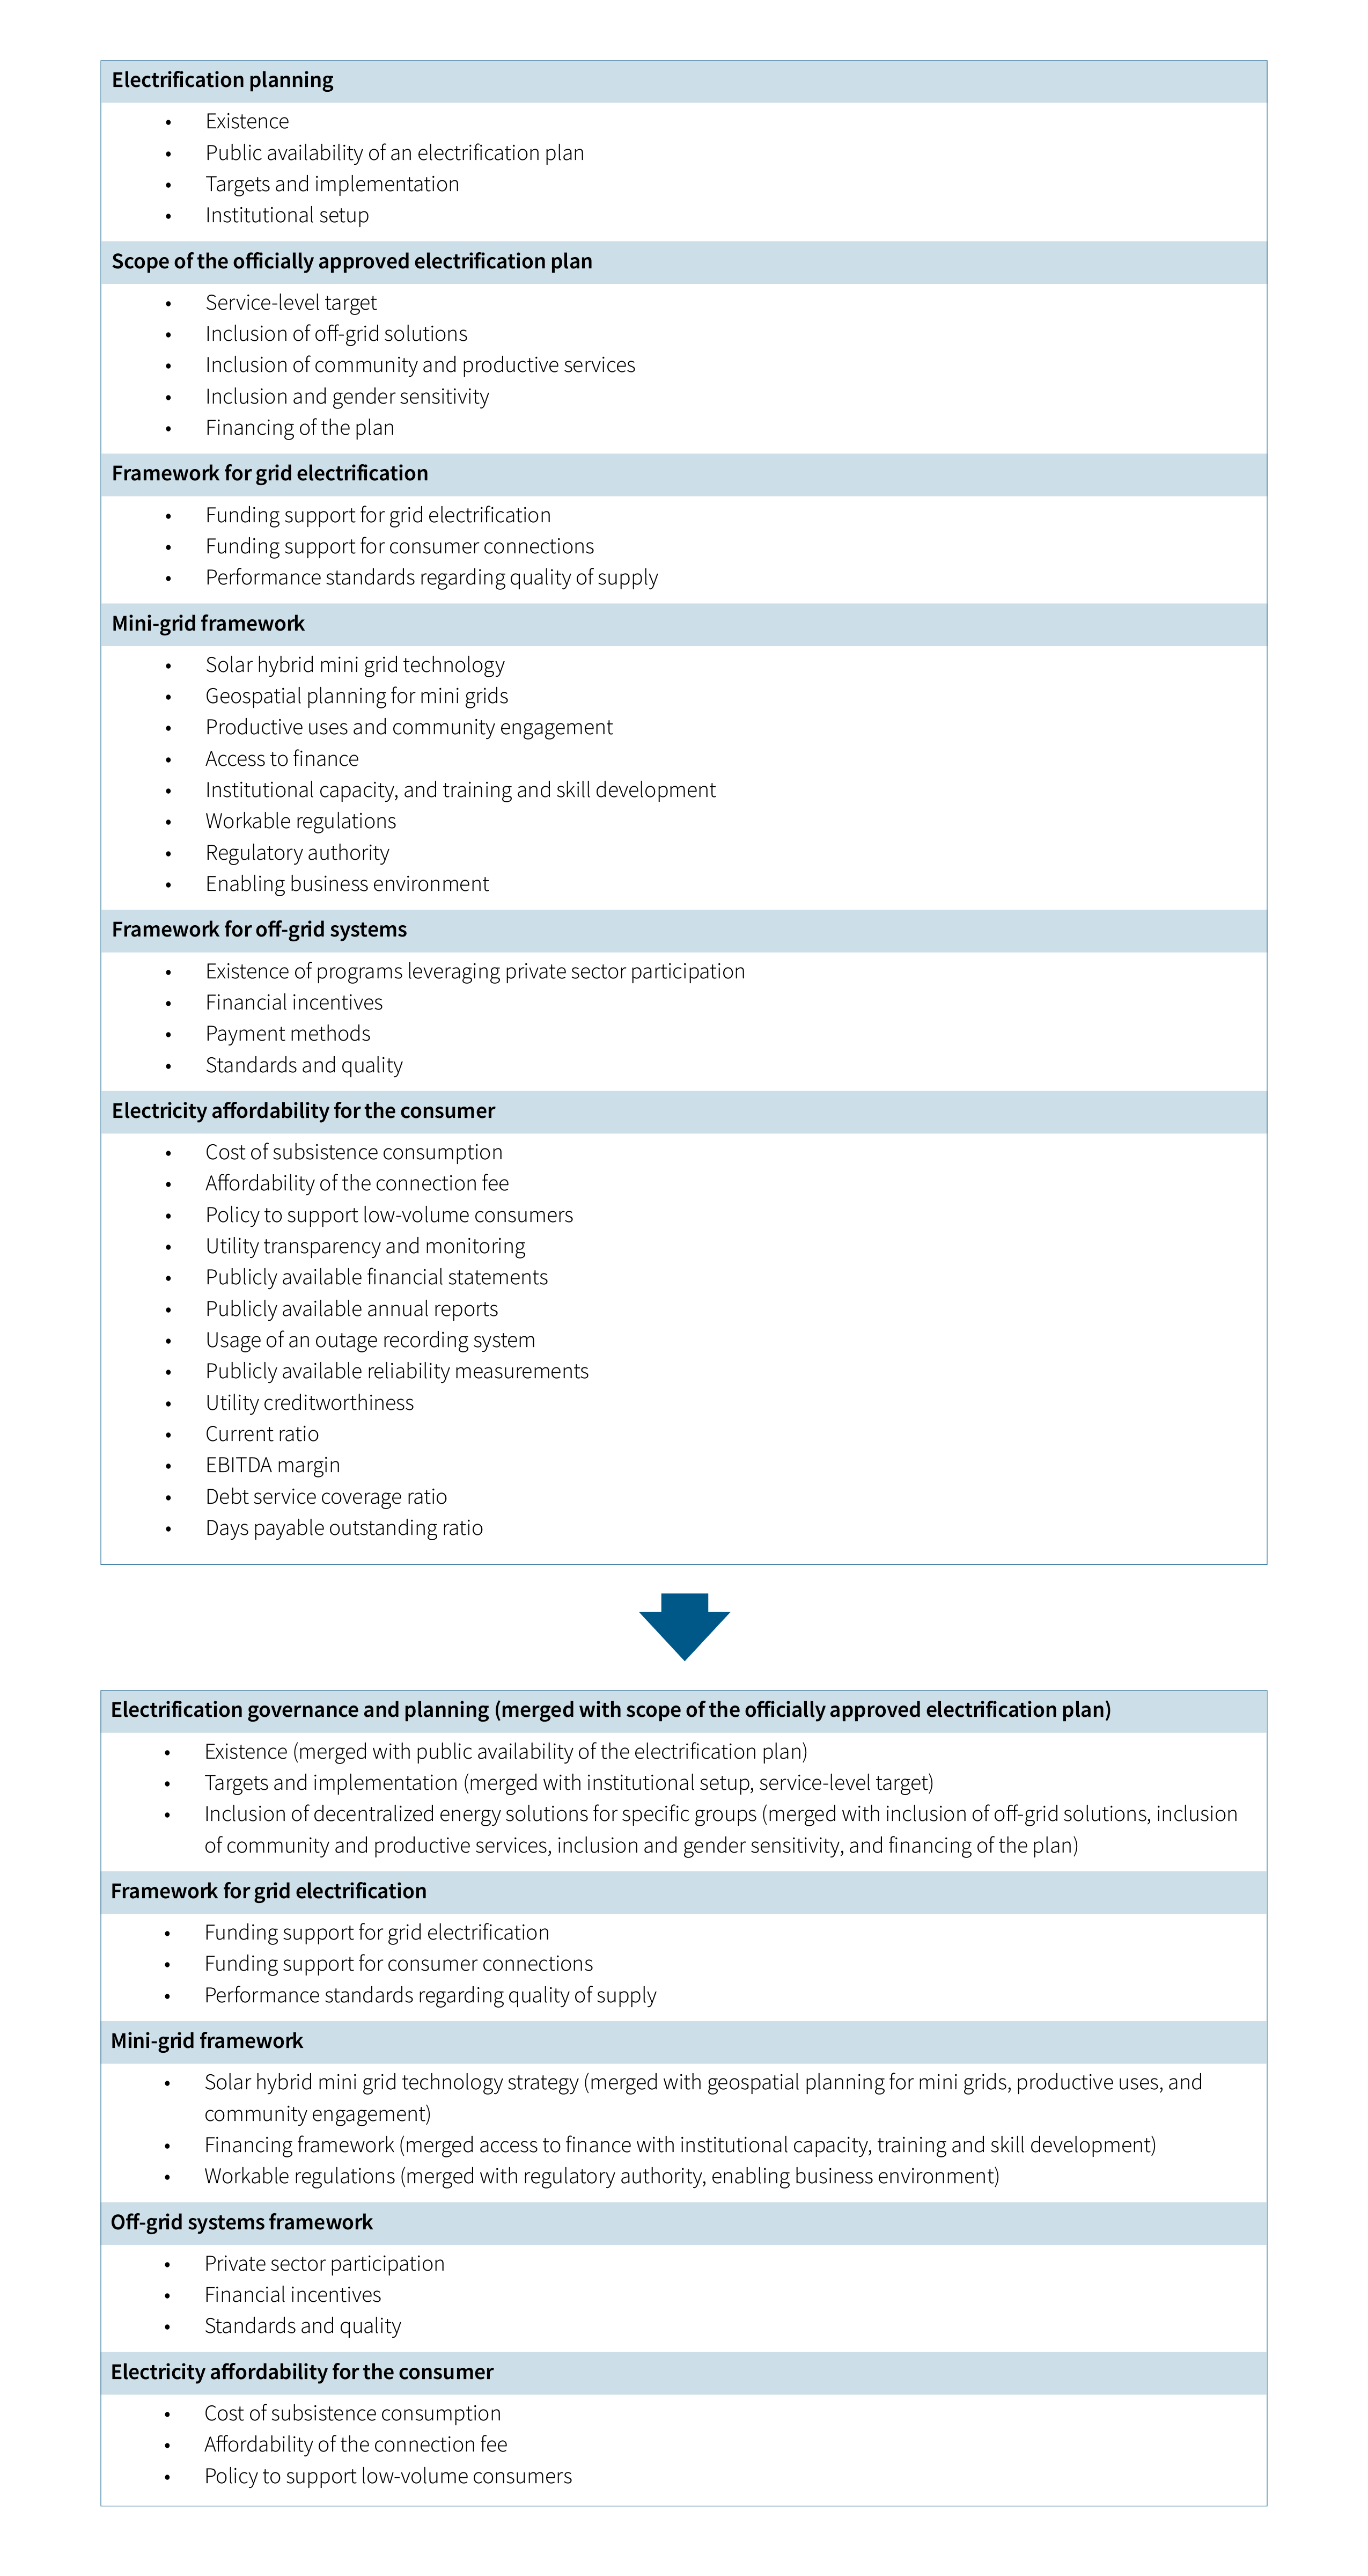
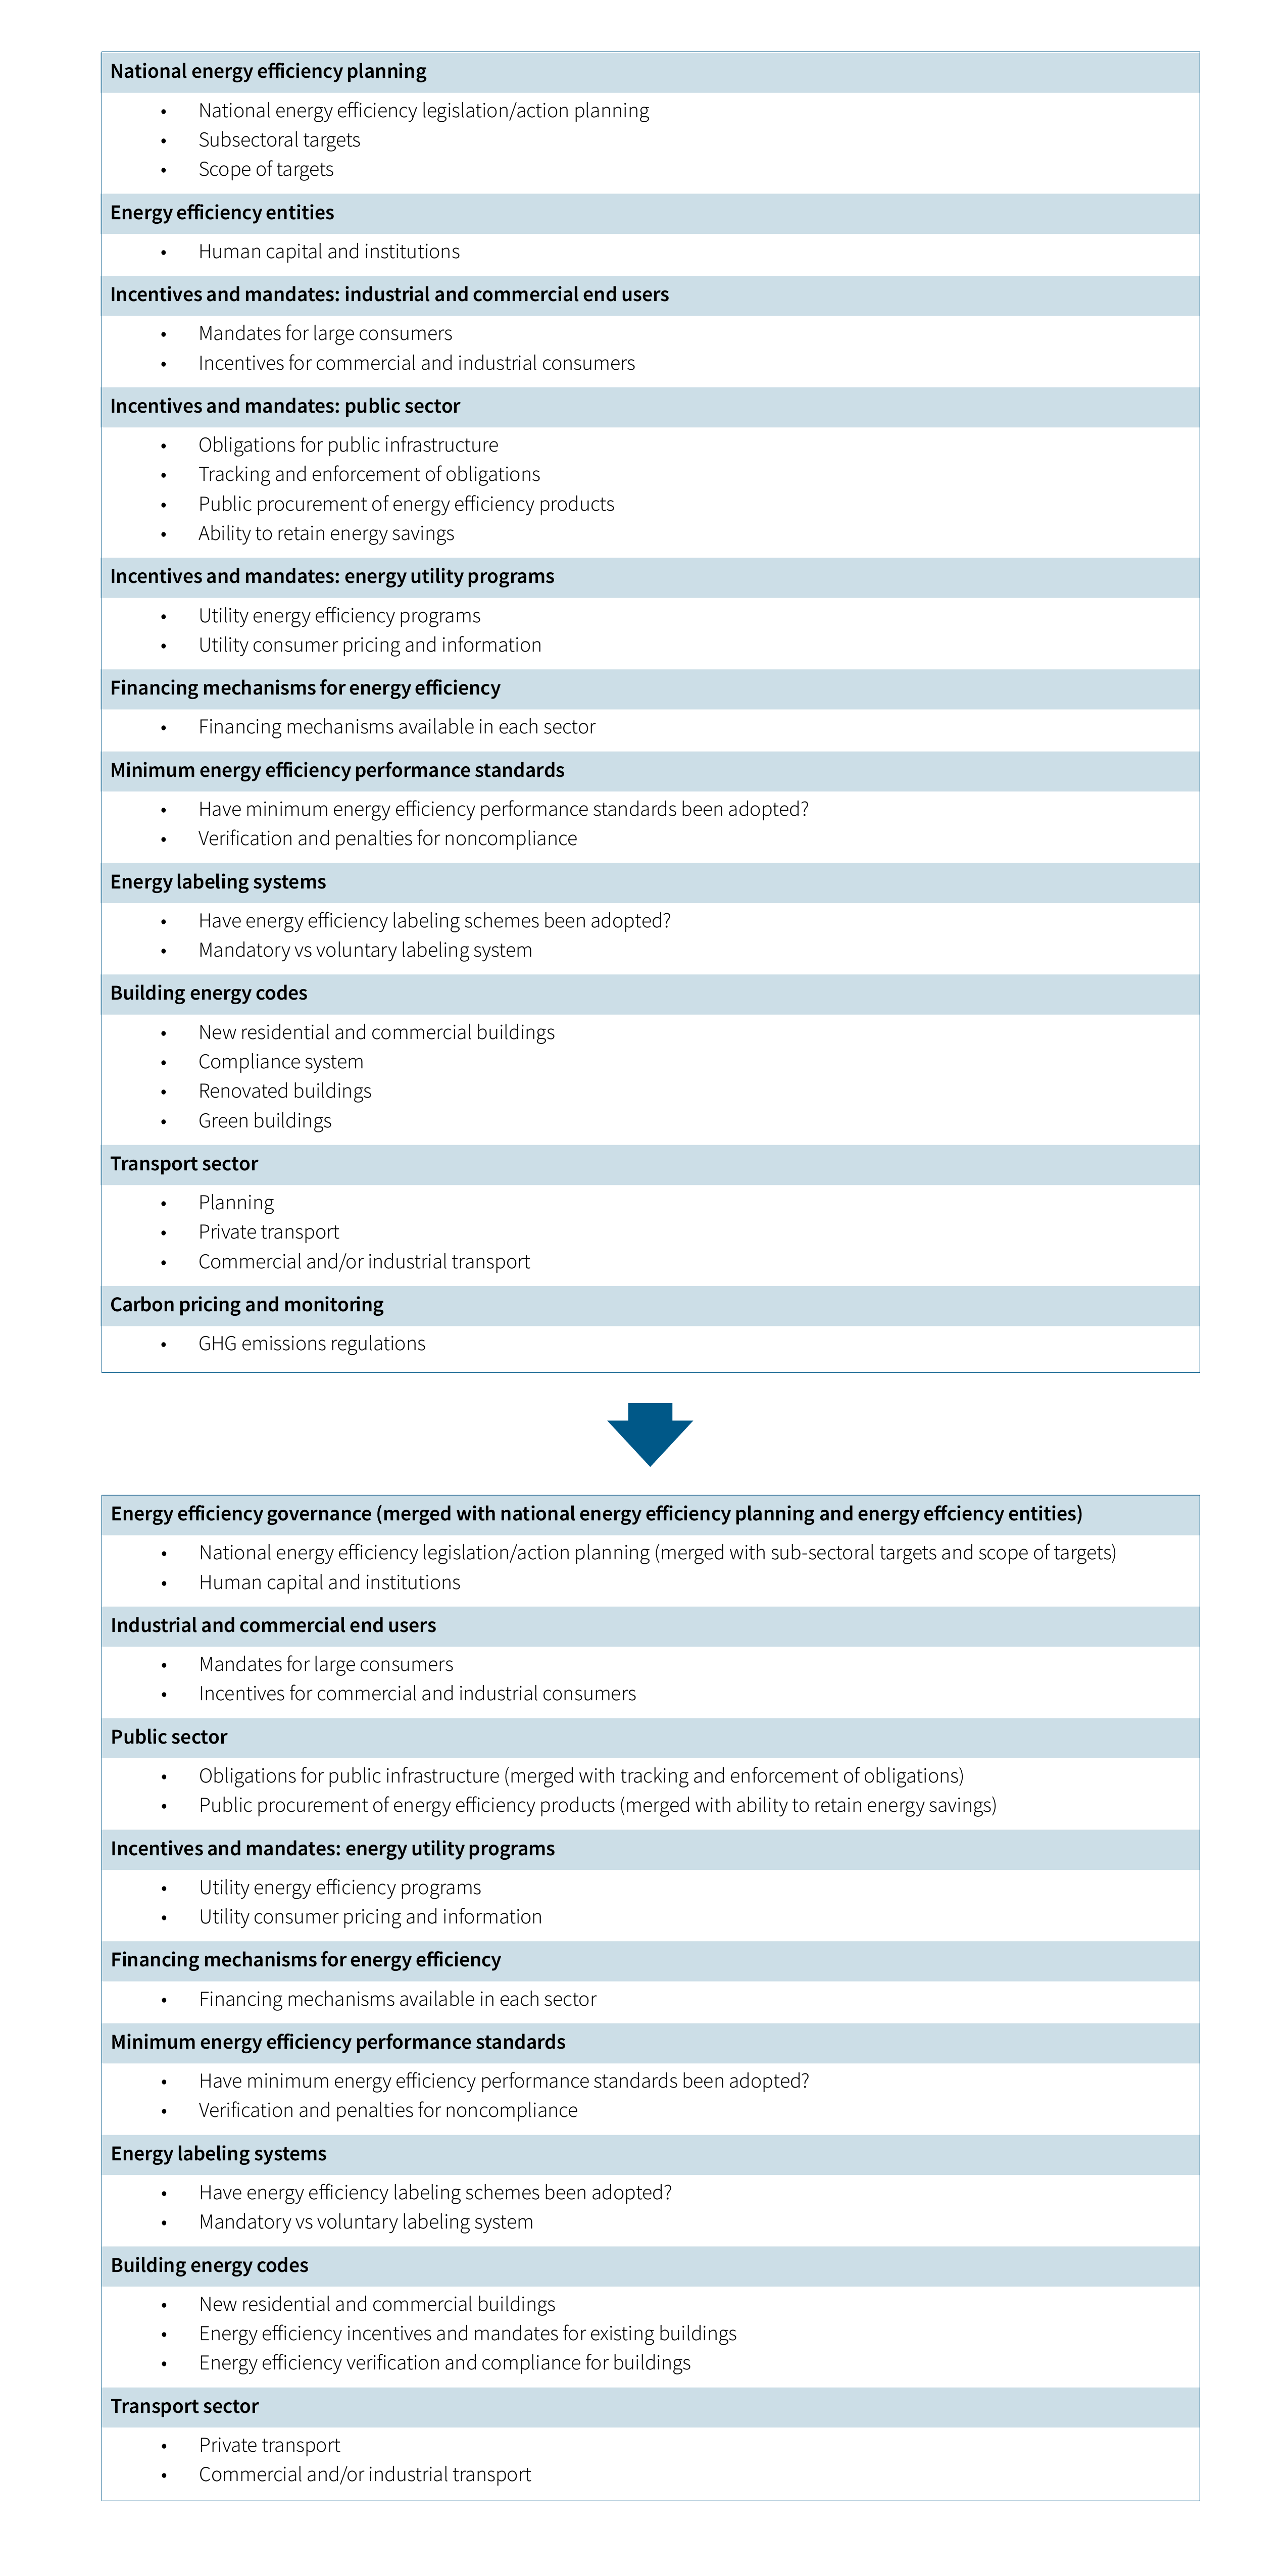
As the renewables pillar went from seven to five indicators, we also sought to streamline the other pillars. The electricity access pillar went from eight to five indicators, and each indicator has now three subindicators (see annex). Likewise, the energy efficiency pillar went from eleven to nine indicators. In both pillars, as in the renewables pillar, we merged subindicators and questions where we could. For example, the energy efficiency entities indicator was merged with the national planning indicator to make a more comprehensive indicator called “energy efficiency governance” (see annex). But the number of indicators in both pillars was also reduced to avoid duplication across pillars.
Previous RISE reports included utility performance indicators in the electricity access and renewable energy pillars. To avoid duplication, this edition removes them altogether from the access pillar. Similarly, carbon pricing was in the renewables and energy efficiency pillars, and here it is kept only in renewables. While we recognize that these indicators are cross-sectional, they were being double-counted for the overall score. Future publications will explore how to link these cross-themed indicators without double-counting them.
Data Collection
RISE is published every even year (2016, 2018, 2020, 2022, 2024). Data collection takes place the year before and must be completed by December 31. In other words, for the RISE 2024 scores published in December 2024, the data collection had to be completed by December 31, 2023.
Two data collection methods were employed for this publication. Data on electricity access, clean cooking, and energy efficiency were collected following the precedent of previous years—through a World Bank vendor, who, in turn, engaged local consultants in each country. These consultants conducted desk research to respond to each question and provide the justification supporting the answer (i.e., a link to the published policy or regulation).
With the renewable energy pillar, we piloted a different approach. The ESMAP team built on different databases that our partners have made publicly available and conducted desk research to close any gaps (table 1.1) This data collection method was not only more resource and cost efficient, but it also allowed us to gain a deeper understanding of the policy and regulatory reforms. As a result, this new data collection method eased both the analysis and the writing of the renewables chapter. RISE may explore replicating the approach for the other pillars in upcoming publications.
Table 1.1 • Databases consulted for the renewables pillar
|
Database |
Author |
|
Carbon Pricing Dashboard |
World Bank |
|
NDC Registry |
UNFCCC |
|
Long-Term Strategies Portal |
UNFCCC |
|
Climate and Clean Air Coalition |
UNEP |
|
UNEP—Law and Environment Assistance Platform |
UNEP |
|
Legal Resources on Renewable Energy |
RES-LEGAL |
|
GSR Policy Data Pack 2023 |
REN21 |
|
Climate Actions and Policies Measurement Framework |
OECD |
|
Energy Policy Review—IEA |
OECD |
|
Climate Action Tracker |
New Climate Institute and Climate Analytics |
|
Climate Policy Database |
New Climate Institute |
|
Industry Transition Tracker |
Leadership Group for Industry Transition—Leadit |
|
NDC RE Targets |
IRENA |
|
RE Power and End-use Targets National Policies |
IRENA |
|
Fossil Fuel Subsidies |
IMF |
|
Energy Policy Tracker |
IISD, IGES, OCI, ODI, SEI, and Columbia University |
|
Renewable Energy Policies and Measures Database |
IEA and IRENA |
|
Global Observatory on People-Centred Clean Energy Transitions |
IEA |
|
GH2 Country Portal |
Green Hydrogen Organization (GH2) |
|
Climate Change Laws of the World |
Grantham Research Institute at LSE and Climate Policy Radar |
|
FAOLEX Database |
FAO |
|
EUR-Lex—Access to European Union Law |
European Union |
|
EU Countries’ 10-Year National Energy and Climate Plans for 2021–2030 |
European Commission |
|
Eurobserv’er Online Database_RES Policy and Statistics Reports |
EurObserv’ER |
|
Asia Pacific Energy Portal |
ESCAP |
|
1.5°C National Pathway Explorer |
ClimateAnalytics |
|
National Hydrogen Strategies and Roadmap Tracker |
Center on Global Energy Policy (Columbia SIPA) |
|
Asean Energy Database System |
ASEAN Centre for Energy |
|
Africa Energy Portal |
APUA, AFUR, AFREC |
|
Sustainable Energy for All—Africa Hub |
ADB, SEforALL, AU, NEPAD, UNDP |
|
Africa NDC Hub |
Africa NDC Hub |
In both methods, once we had all the answers to our questions and had prepared the preliminary scores, we shared them internally with World Bank local experts for their feedback. Once that feedback (if any) was addressed, we finalized and published the data. Future publications will explore engaging external experts, such as regional and national regulatory bodies, in this review process.
References
Blanchard, O., C. Gollier, and J. Tirole. 2023. “The Portfolio of Economic Policies Needed to Fight Climate Change.” Annual Review of Economics 15: 689–722.2023
Borenstein, S., and L. W. Davis. 2016. “The Distributional Effects of US Clean Energy Tax Credits.” Tax Policy and the Economy 30 (1): 191–2342016.
Fabra, N., and M. Reguant. 2024. “The Energy Transition: A Balancing Act.” Resource and Energy Economics 76 (February): 1014082024.
Farole, T. 2011. Special Economic Zones in Africa: Comparing Performance and Learning from Global Experience. Washington, DC: World Bank. https://openknowledge.worldbank.org/entities/publication/8fb20e3d-7672-5...
Gouchoe, S., V. Everette, and R. Haynes. 2002. Case Studies on the Effectiveness of State Financial Incentives for Renewable Energy. Golden, CO: National Renewable Energy Laboratory (NREL). https://ncsolarcen-prod.s3.amazonaws.com/wp-content/uploads/2015/01/2002...
IMF (International Monetary Fund). 2015. “Options for Low Income Countries’ Effective and Efficient Use of Tax Incentives for Investment: Tools for the Assessment of Tax Incentives.” A background paper to the report prepared for the G-20 Development Working Group by the IMF, Organisation for Economic Co-operation and Development (OECD), United Nations, and World Bank Options for Low Income Countries’ Effective and Efficient Use of Tax Incentives for Investment. https://www.imf.org/external/np/g20/pdf/101515a.pdf.
Klemm, A. 2009. “Causes, Benefits, and Risks of Business Tax Incentives.” IMF Working Paper WP/09/21, International Monetary Fund, Washington, DC. https://www.imf.org/external/pubs/ft/wp/2009/wp0921.pdf.
Metcalf, G. E. 2007. “Federal Tax Policy Towards Energy.” Tax Policy and the Economy 21: 145–84. https://www.jstor.org/stable/20061917.
OECD (Organisation for Economic Co-operation and Development). N.d. “Principles to Enhance the Transparency and Governance of Tax Incentives for Investment in Developing Countries.”
Rapson, D., and E. Muehlegger E. 2023. “Global Transportation Decarbonization.” Journal of Economic Perspectives 37 (3): 163–88.
UNCTAD (United Nations Conference on Trade and Development). 2023. “Investment Policies for the Energy Transition: Incentives and Disincentives.” Investment Policy Monitor, Issue 26, November 2023. https://unctad.org/system/files/official-document/diaepcbinf2023d8_en.pdf.
World Bank. N.d. “UPBEAT: Utility Performance and Behavior Today.” https://utilityperformance.energydata.info/.
Annex • RISE Pillar Changes between 2022 and 2024
Figure A.1 • Renewable energy pillar changes between 2022 and 2024 Figure A.2 • Electricity access pillar changes between 2022 and 2024
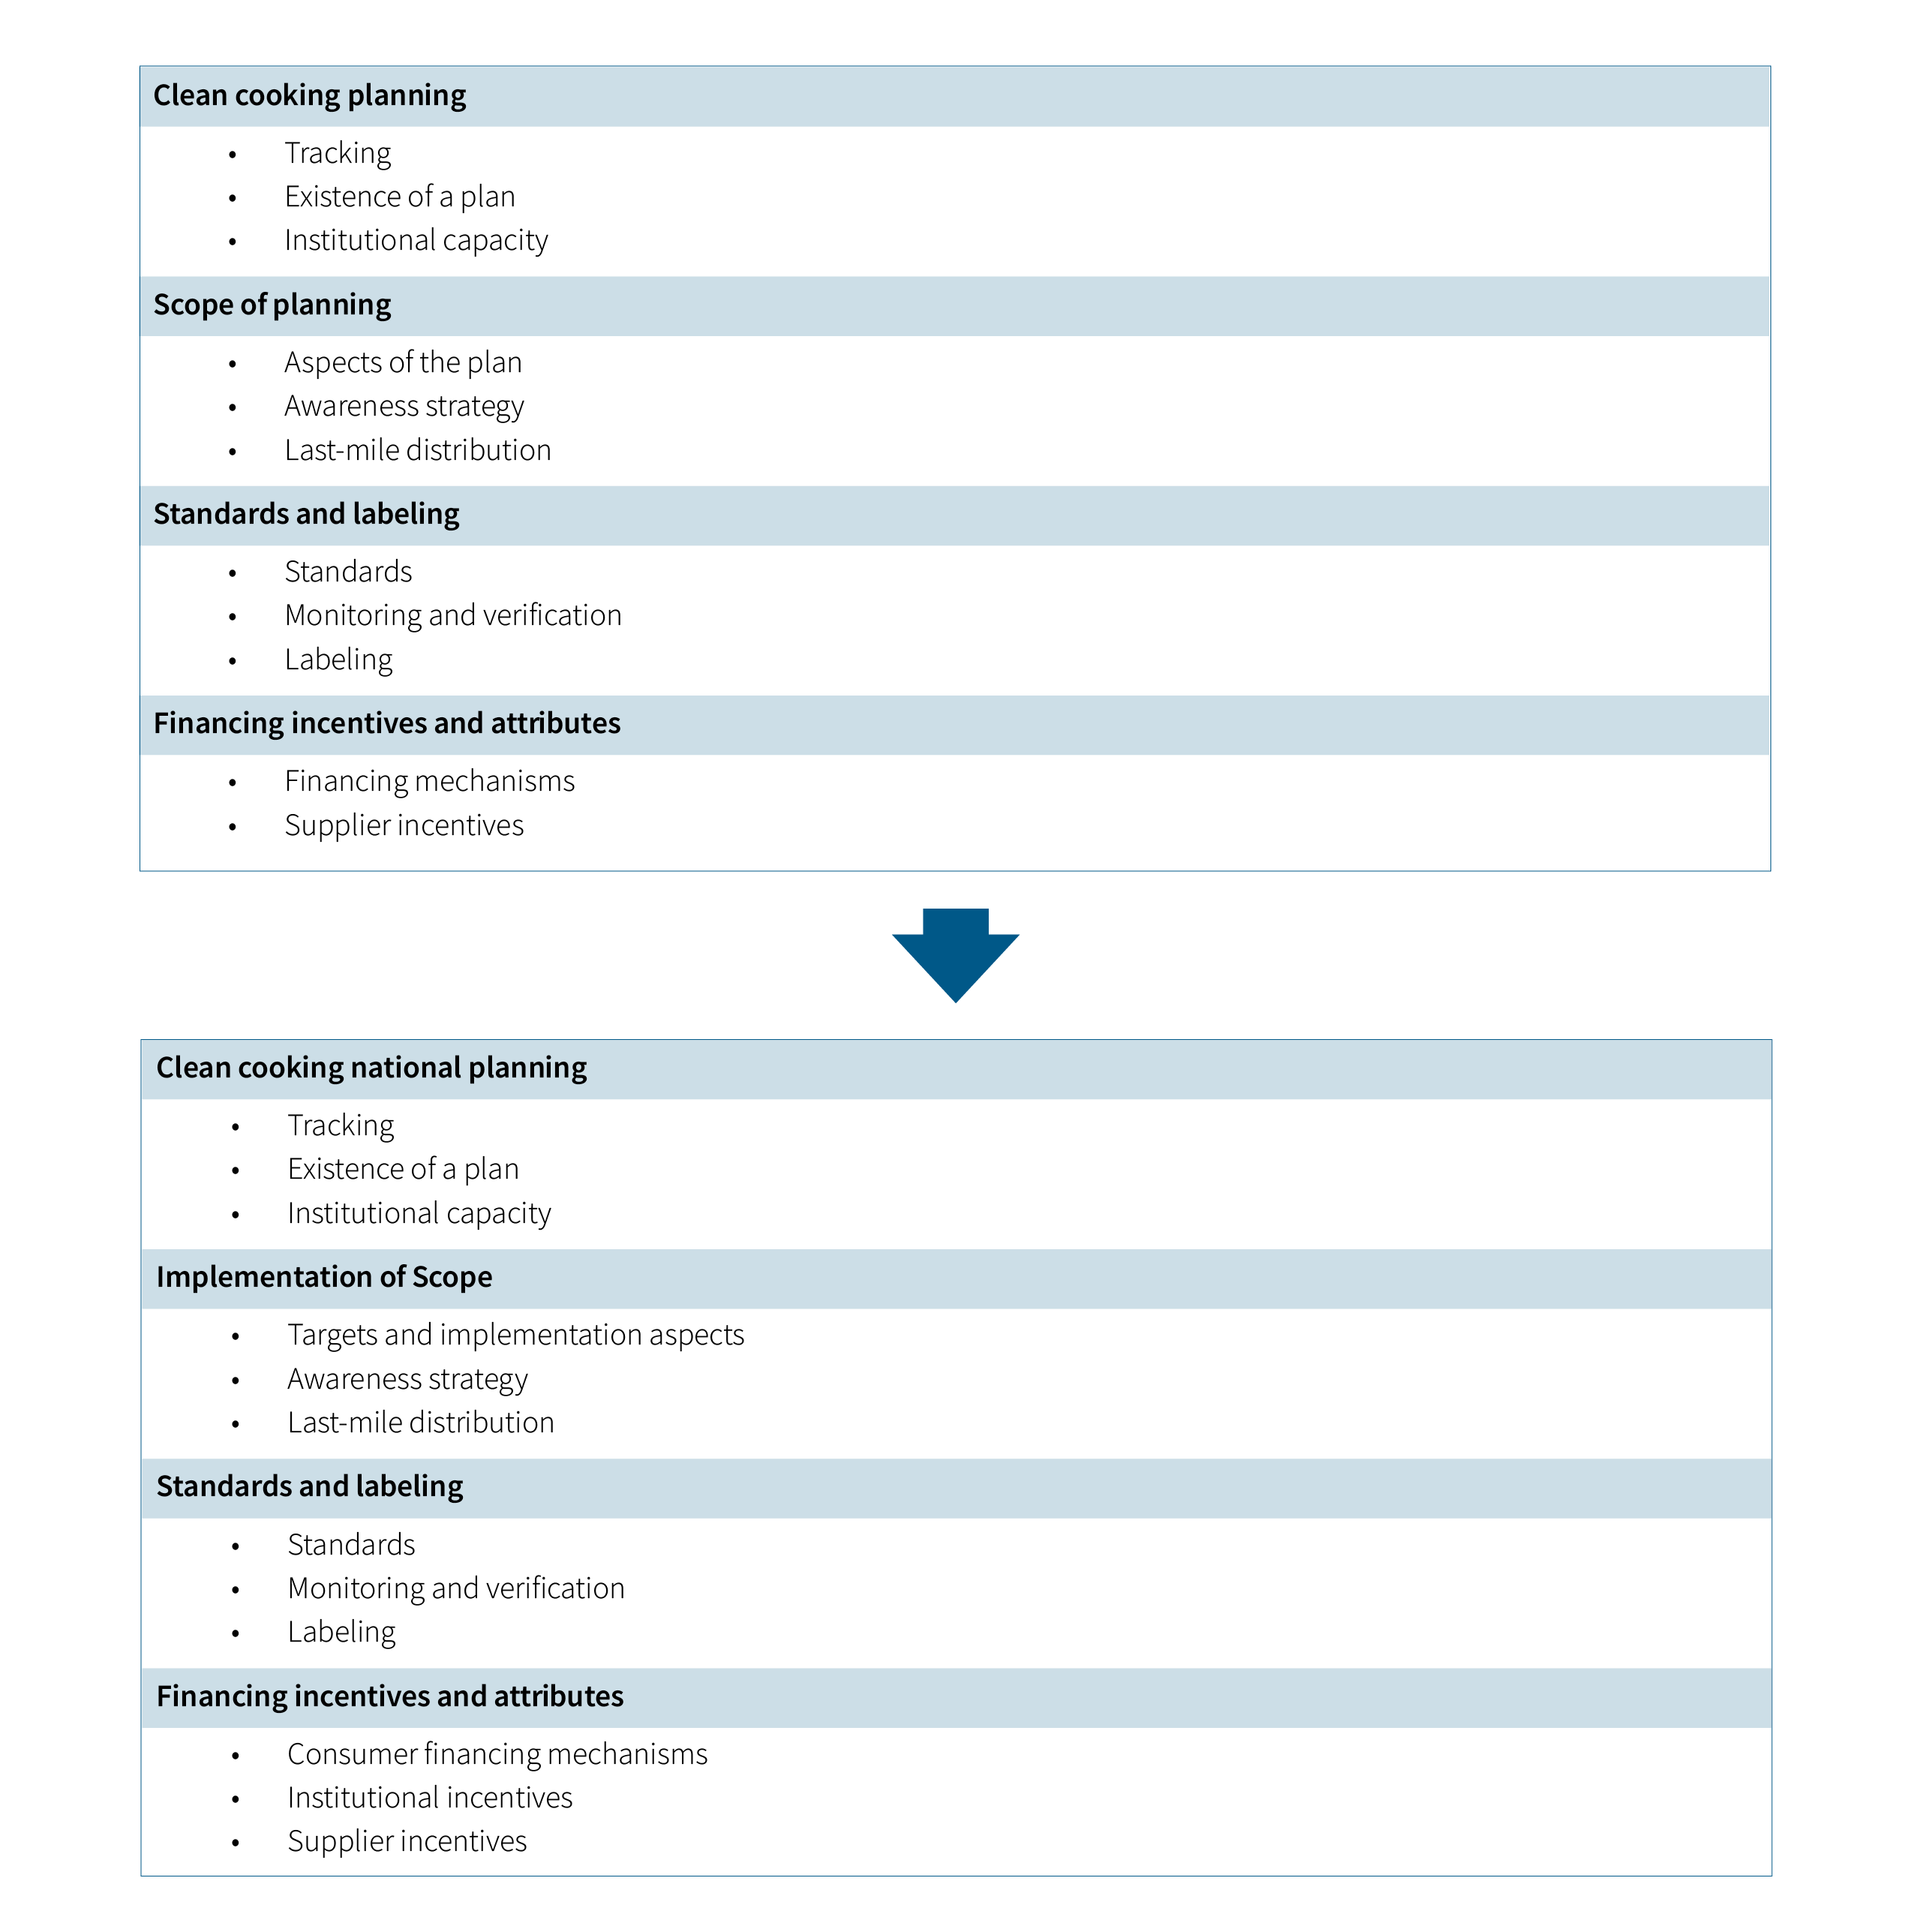
Figure A.3 • Energy efficiency pillar changes between 2022 and 2024Figure A.4 • Clean cooking pillar changes between 2022 and 2024
1 Most of the global population without electricity access —over 85 percent— is in Sub-Saharan Africa, while East Asia & Pacific and South Asia each account for approximately 5 percent. Only a few countries with major electricity access gaps are not included, such as Botswana, Gabon, Equatorial Guinea, Lesotho, Namibia, and a few others.


